
09 Sep Guide to Google Analytics
A Guide to the Google Analytics User Metrics That You Should Be Looking At
If you have spent any time in Google Analytics then you will know that there are a lot of stats and data there that can quickly overwhelm you. Many won’t make it past the first page as they simply have no real understanding of what they should be looking for. In this post we are going to help you with a few pointers that will help you better assess what you are looking at.
The real trick to analytics is not trying to learn everything, just what you need to know in order to assess the performance of your site.
Most people will look at this graph to get an overall assessment of what their site is doing.
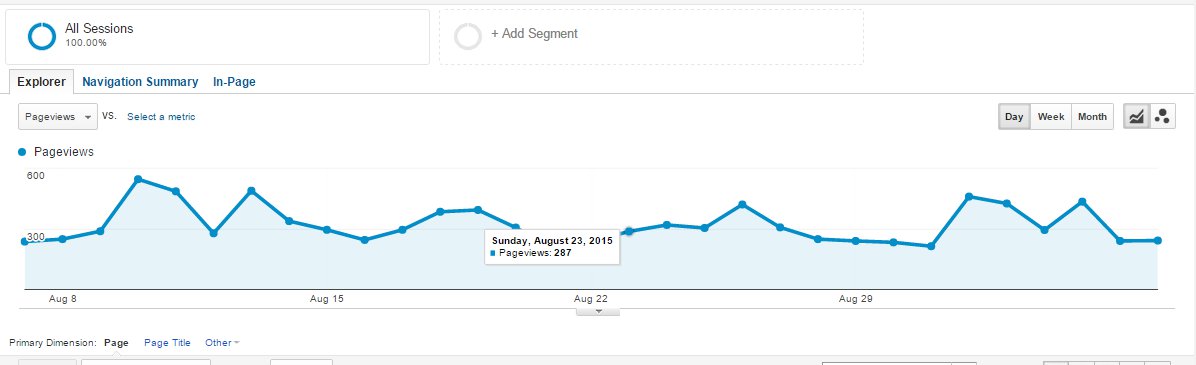
This can be very misleading as this is the overall picture and can mask what is really happening to the website
Organic Traffic and Referral Traffic In Google Analytics
One of the first things that you want to do is it to break down the traffic coming to the site. This is very important , for example if you wanted to see what traffic that you are getting from the search engines (Google) then you would just focus on organic traffic. If you have been running a competition on Facebook then you would be looking more at the referral traffic.
There is a very handy area on the left hand side called “Acquisition” that can help you with the breakdown of all of your traffic. If you go there and then click on the overview this will give you this:
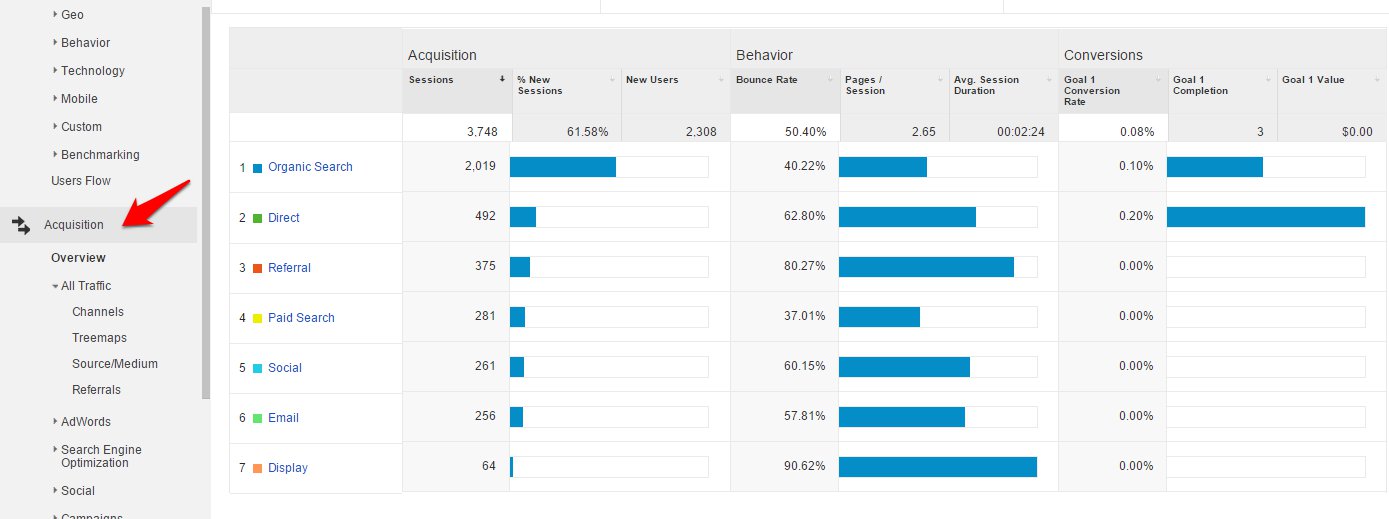
Now this is all great but it does not really help us really see what is going with your site. In the next section we are going to be looking at what you should try to get to grips with when you are in Google Analytics.
Why Are These Metrics Important To You?
Recently the SEO landscape has made a big shift towards the content on your site. While link building is still important, it is now becoming almost impossible to rank a site that does not have great content and does not give the user what they are looking for.
Google brought out an update called Hummingbird in August 2013 and this was a core algorithm update that moved Google closer to understanding user intent (basically what content people were looking for when they made a search).
This has progressed somewhat from there and Google has become very good and understanding this. Your keyword rankings will be influenced by these metrics. Google wants to show pages that are the best match for the user; if the metrics below don’t support that then Google will rank another page in its place.
Google Analytics have given us the tools to see and assess how your content is doing when it comes to user intent. While there are many factors that will be taken into account here are some of the most important that you can look at the will help you assess what will need to be done.
It is because of this that looking at the metrics below should be done on a page by page level not on a site level. At a site level this is an average while at a page level this is accurate for that particular page. It is well known that Google looks at individual pages when assessing for rankings
Because of this we must further refine our data look at individual pages on the site:
On the left hand side find the link “Behaviour” and clicking on this should open up a sub link to “Site Content” open this and click on “All Pages”.
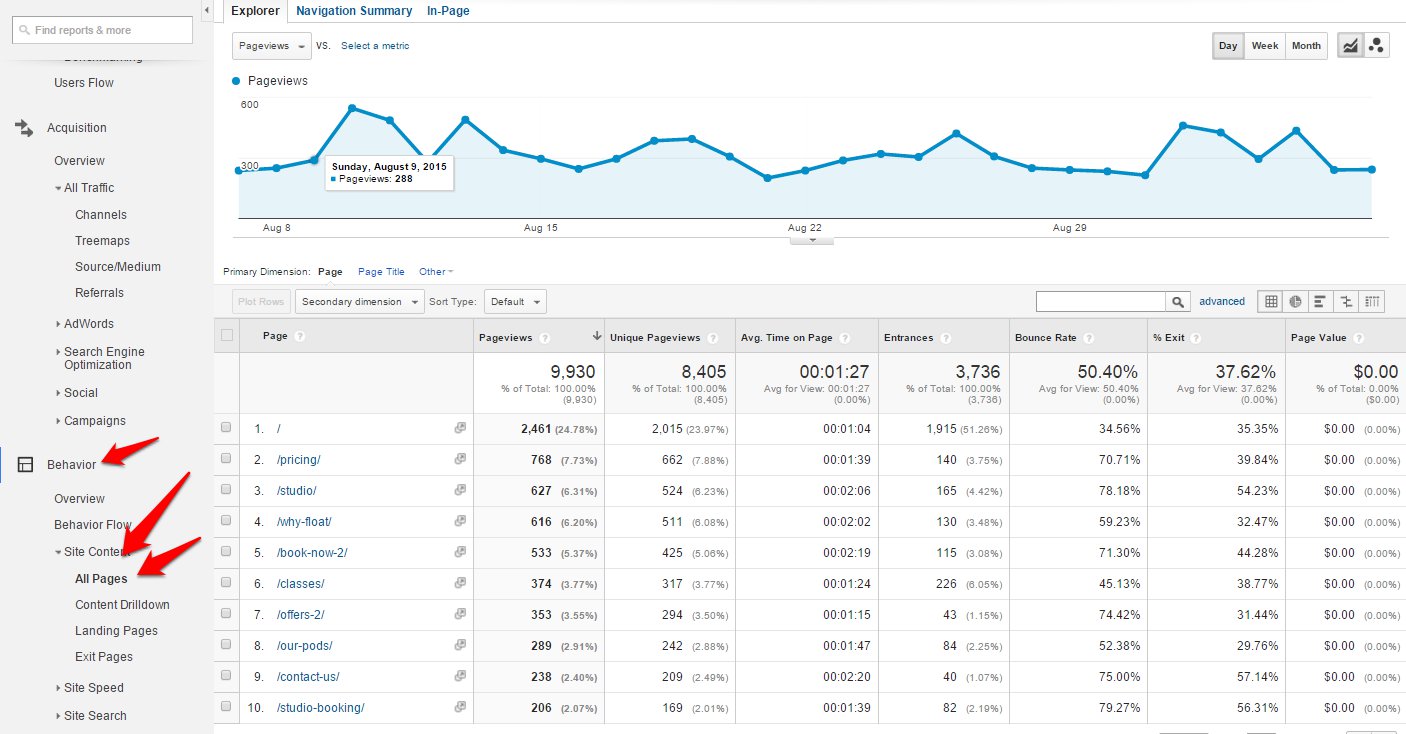
There is a dropdown at the bottom that allows you to show how many pages; it is set at 10 on default. Change this to what you feel is better for you.
Now we can get into the meat of the post:
Bounce Rate in Google Analytics
There has been a lot written about how bounce rate works, but the basic explanation is this: People that land on a page and then leave without going elsewhere on the site will be counted as a bounce. This is pretty significant data as it is showing us exactly what the reader thinks of your page. If the user comes to the site then leaves immediately it means the page has not given them what they want.
If you have navigated to the right place you will notice that this information is broken down on an individual page level. This is pure gold for you as you can now see what pages are doing badly and what pages are doing well. Those pages that have a high bounce rate should be looked at to see if you can assess why.
(How to actually sort this is beyond the scope of this article but there is a lot written online and there are agencies like us that can help with this.)
As with many things SEO this is not the full picture because there are factors that you will need to take into account when you are looking at these metrics. This brings us nicely onto the next metric that overlaps with bounce rate.
Time on Page
This metric tell you how long the user spent on the page. Basically the longer someone spends on a page the better. This of course is relative and should be looked in accordance with how the other pages are performing. You can use this in relation to the bounce rate.
Let’s make up two pages:
Page one has a high bounce rate and a very short time on page compared to the rest of the site.
Page two has the same high bounce rate but people are spending three times more time on this page.
What should you do with these two pages you ask? Good question. Google will see the first page as one in which the user did not find what they were looking for while the second page indicate that the user found what they were looking for and moved onto to the next search. (Take a moment here to think about your behaviour when using the internet.)
If your page falls into the second section then it might be needing some call to action on the page to get people to click though to other content on the site.
This brings us nicely to the next section.
Pages per Session
This one can be looked at a site level and will show the average number of pages that your visitors are going to. This is an indication of the level of engagement that you site has. Depending on the type of site you have this will vary. If you have an ecommerce site then you would expect this to be higher. Generally though the higher this is the better.
Having a look at these metrics will give you an idea of what is happening on you site and what actions you need to take to improve your websites performance. It is important to realise that these figures will all vary according to the traffic source. My last little trick will help you easily use the above for the different types of traffic that you want to look at.
Traffic Sources
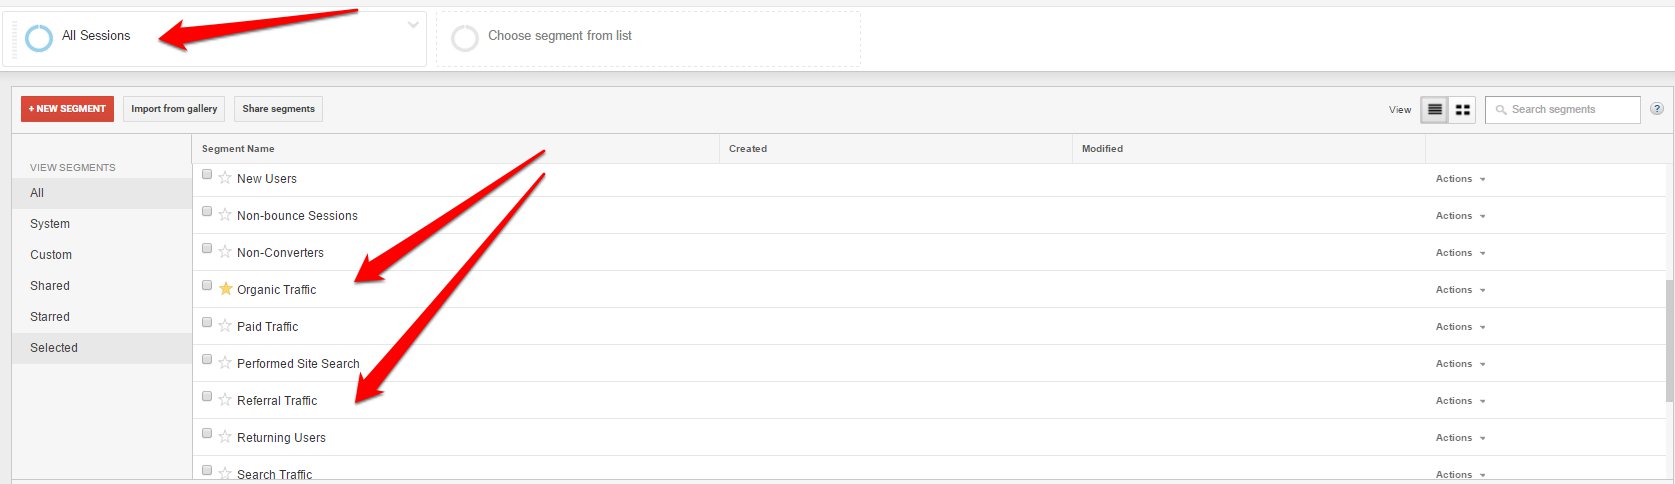
The best way to sort out the traffic that you want to analyse is to go the top of the page. There is a little bar on the top that looks like this.

If you click on the All Sessions Button you will get a dropdown and from there you can choose what type of traffic you are looking to analyse. Our go-to option is organic traffic as this shows traffic from Google. This is what you should be seeing when you open this up.
Well there you have it, hopefully you should now have an idea of what you should be looking for when you are spending time in Google Analytics trying to assess your site. This will help you give you some direction and ultimately improve your content on the website. You should spend some time thinking about what you are trying to achieve with your content. Armed with this and a little knowledge of how to use Google Analytics you should be able to set about improvements that will benefit both you and your users.
No Comments